Home
What the GONI Project is
The Global Open Neighbourhood Index (GONI) Project consists of two parts.
First, the GONI score is a globally consistent, neighbourhood-level (1 km2) composite indicator built from satellite and point-based data. Each neighbourhood hexagon captures crucial dimensions of everyday life, including economic activity, population density, political mobilisation, knowledge creation, and environmental conditions, placing each neighbourhood within its local, regional, and global context.
Second, GONI Globe allows fast visualisation and search functionality for rapid understanding of 'where in the world' neighbourhoods stand, with the option to analyse individual dimensions for detailed and transparent analysis.
What GONI Globe looks like
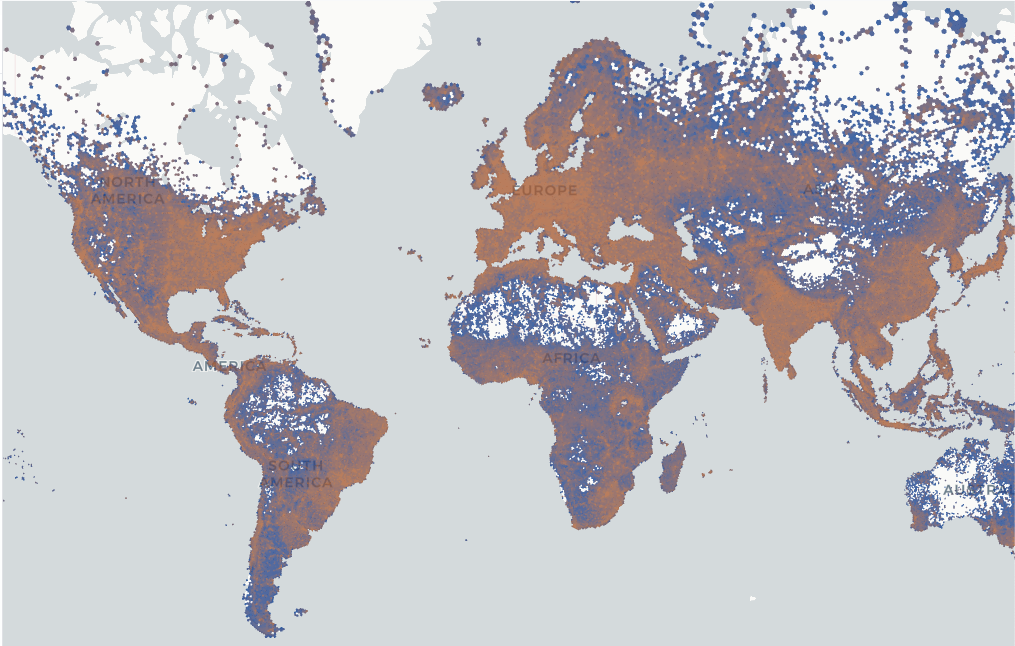
GONI Globe provides neighbourhood-level, context sensitive, comparison across the world in standardised hexagons. For instance, the example below shows the global map, with orange indicating higher GONI Scores.
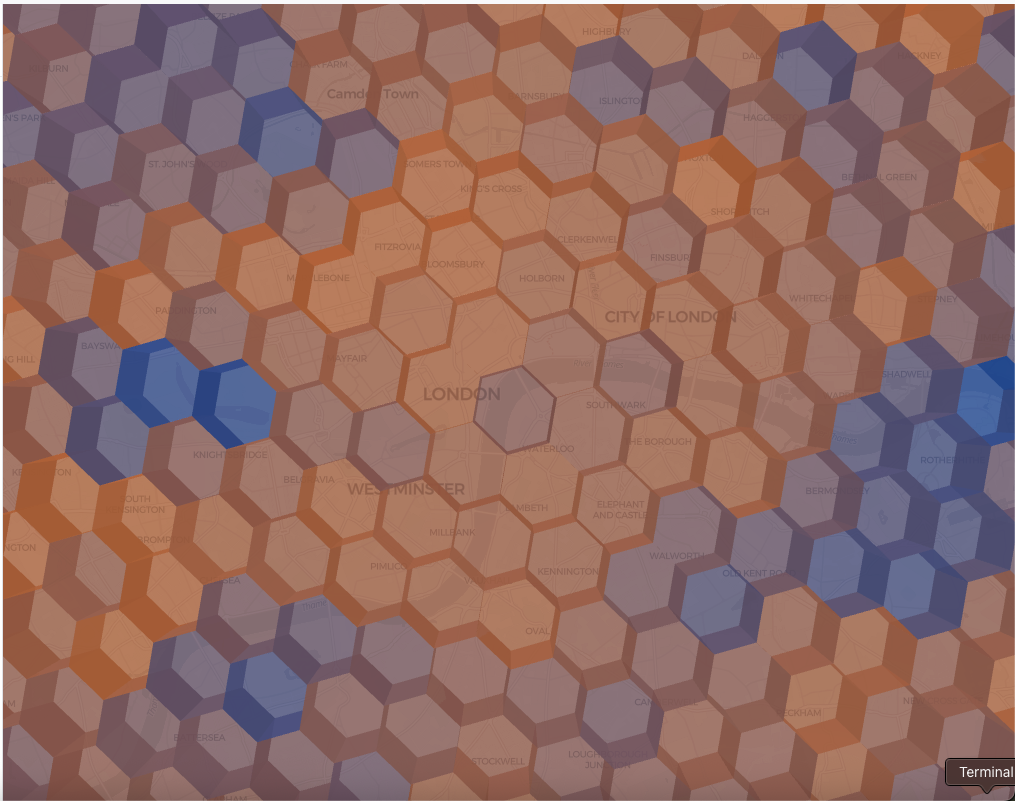
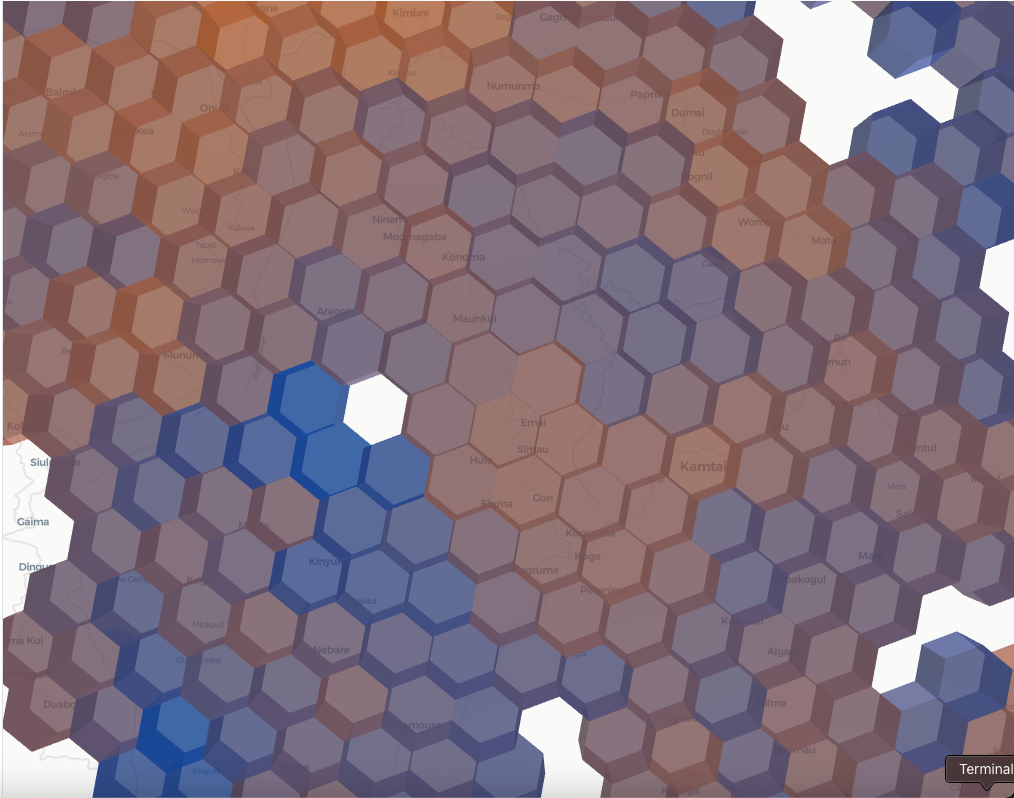
The two examples show London being compared with the same spatial reference unit as Giu, which is in the Kundiawa District Highlands Region, Papua Niugini. The scale adjusts depending on local context, with orange values in London indicating GONI Scores of up to 90.85, and up to 72.63 in Giu (zoom for more details, or use GONI globe for expanded interactivity.)
Global coverage of neighbourhood-level GONI scores
London, UK
Xinyu, China
The GONI approach
GONI divides the world into over 200 million neighbourhoods of roughly one square kilometre (H3 r8), capturing the immediate local environment people experience day to day. These neighbourhoods are nested inside larger hexagons: several r8 cells combine to form a local area (r6), and several r6 areas combine to form a regional unit (r4). This layered structure makes it possible to see how l ocal neighbourhood conditions sit within wider local, regional, and global contexts — all using the same consistent grid, rather than administrative boundaries. The animation below explains this, centred on one neighbourhood.
What’s included
The indicator includes global data on economic activity, population density, service provision, repression (protests), knowledge creation and environmental attributes.
| Dimension | What it captures | Measure / scale | Data source |
|---|---|---|---|
| Population | Resident population intensity; baseline city size for scaling and per-capita normalisation | Population count / density per 1 km² grid cell | UN JRC GHSL Population Grid |
| Social infrastructure | Presence of amenities, services, and social infrastructure used to define cities and centres | Point-of-interest coordinates | Overture Maps |
| Economic activity | Human activity and energy use; proxy for production and consumption | Night-time radiance per ~500 m grid cell | VIIRS Night-Time Lights (EOG) |
| Knowledge creation | Spatial distribution of scientific output and research institutions | Geocoded publications and institution points | OpenAlex |
| Political mobilisation | Protest and conflict events capturing collective political action | Event-level geocoded points | ACLED |
| Greenhouse gas emissions | Spatial distribution of CO₂ and other GHG emissions from economic activity | 0.1° × 0.1° global grid cells | EDGAR Emissions Inventory |
How scores are interpreted
GONI resolves this by anchoring each neighbourhood’s score simultaneously at three spatial scales:
- Local context – how a neighbourhood compares to nearby neighbourhoods,
- Regional context – how the local area compares within its wider region, and
- Global context – how the region compares to all regions worldwide.
Rather than forcing a single scale of comparison, this (local, regional, global) structure ensures that neighbourhood scores remain meaningful close to home while still being comparable across regions and countries. Each score can be interpreted as a score out of 100. For instance, a score of (70,10,90) would indicate a neighbourhood that is developed in relation to its local context, but that the surrounding area is weak relative to the other local areas, yet the region is strong. Breakdowns within each of these index scores are also available - to understand if a neighbourhood is particularly strong or weak in one of the dimensions in particular.
Key properties
This construction guarantees that:
- Local scores describe neighbourhood conditions as they are experienced on the ground, capturing fine-grained variation at the scale of everyday life.
- Regional scores place each neighbourhood in context, showing how local conditions relate to the wider surrounding area.
- Global scores situate neighbourhoods within a common worldwide reference, allowing consistent comparison across countries.
- All comparisons are made using the same spatial framework at every scale, providing a clear and consistent alternative to administrative boundaries.
A summary of the full method for the GONI Project is available here. Detailed implementation documentation, data schemas, and fully reproducible code are provided separately.